Shoppers reducing fat
If total or saturated fat is your priority, compare bars per 100g, then check carbohydrate, sugars and the amount in the bar you will eat. A lower fat figure does not settle the carbohydrate question.


Reduced fat alone does not tell you whether a cereal bar fits a diabetes-aware snack plan. Diabetes UK advises checking total carbohydrate, which front-of-pack traffic lights do not show. Compare the amount for the portion you intend to eat, then consider sugars, total fat and saturated fat alongside it.
The useful label values depend on why you are comparing bars: reducing fat and keeping track of carbohydrate are separate considerations.
If total or saturated fat is your priority, compare bars per 100g, then check carbohydrate, sugars and the amount in the bar you will eat. A lower fat figure does not settle the carbohydrate question.
Diabetes UK explains that carbohydrate counting uses the amount eaten and that insulin-to-carbohydrate ratios are individual. Check the declared carbohydrate for your actual portion rather than relying on the multipack’s front label.
Sugars, total fat and allergens can differ between oat, protein and nut-based bars. Compare the same label values across the exact products rather than treating a protein or lower-sugar description as a reduced-fat claim.
Start with total carbohydrate for the amount you expect to eat. Use per-100g figures to compare bars of different sizes, then return to the per-bar figures for your chosen portion.
| Priority | What to check | Your needs |
|---|---|---|
| Carbohydrate and portion | Find total carbohydrate per bar or serving on the nutrition panel. Check whether the stated serving matches the number of bars you intend to eat; use per-100g figures when comparing different pack sizes. | “I need to know the carbohydrate in the portion I am planning to eat, not just the suggested serving.” Diabetes UK notes that front-of-pack traffic lights do not give total carbohydrate. |
| Fat, saturates and sugars | Compare total fat, saturated fat and sugars per 100g, then read the amounts per bar. A lower figure in one column does not establish a lower figure in another. | “Reducing fat matters to me, but I also want to see the sugars and carbohydrate before choosing a bar.” Kellogg’s UK lists 20g carbohydrate and 7.6g sugars per 27g Special K Red Berry Bar. |
| Claims and nutrition panels | Read beyond words such as “light”, “protein” or “lower sugar”. Check the current nutrition panel and ingredients for the exact variant, particularly if its recipe or pack has changed. | “A front-label claim catches my eye, but I want the figures behind it.” Waitrose & Partners lists 2.7g sugars and 6.5g fat per 30g serving of Graze Cocoa Vanilla Oat Boosts. |
| Ingredients and allergens | Read both the ingredients and any “may contain” statement on the current pack. Check the exact bar rather than assuming every product from a brand uses the same ingredients. | “If I need to avoid an ingredient, I want to check this flavour and pack, not rely on another bar in the range.” |
Fat, sugars and total carbohydrate answer different questions. Kellogg’s UK lists 20g carbohydrate per 27g Special K Red Berry Bar; Waitrose & Partners lists 2.7g sugars but 6.5g fat per 30g serving of Graze Cocoa Vanilla Oat Boosts.
Read all three values, plus saturated fat, for both 100g and the portion you expect to eat.
Diabetes UK notes that front-of-pack traffic lights do not show total carbohydrate. A colour for sugars cannot stand in for the carbohydrate figure.
Find total carbohydrate in the nutrition information and check whether it is stated per bar, per serving or per 100g.
The product figures differ: Nature Valley UK lists 11.1g fat per 40g Chocolate & Coffee Protein bar, while TREK lists 11g per 50g Cocoa Oat bar. Neither name tells you the fat content of another bar.
Compare total and saturated fat directly when reducing fat is your reason for choosing.
Kellogg’s UK and Nature Valley UK both advise checking packs because products can be reformulated. Changes may matter when you are comparing nutrients or avoiding ingredients.
Check the nutrition table, ingredients and allergen statement on the pack you are buying.
These examples show why the exact bar matters more than a brand-wide assumption. Figures below apply to the named products and stated portions.
The Special K Red Berry Bar offers a cereal-bar example for comparing fat with carbohydrate.
Cocoa Vanilla Oat Boosts is an oat-bar example where sugars and total fat call for separate checks.
Chocolate & Coffee Protein is relevant if you are comparing a protein bar with cereal bars, rather than assuming it has less fat.
Cocoa Oat is a plant-protein flapjack to assess on its own label values.
Dark Chocolate & Peanut Protein Bar is a nut-based option, not a substitute for checking a cereal bar’s fat figure.
Alpen’s No Added Sugar product is muesli rather than a cereal bar, so its figures should not be used to judge an Alpen bar.
These cereal-bar multipacks provide options for checking fat alongside carbohydrate, sugars and portion size. The product name identifies each pack; use its current nutrition label for the figures that matter to your choice.
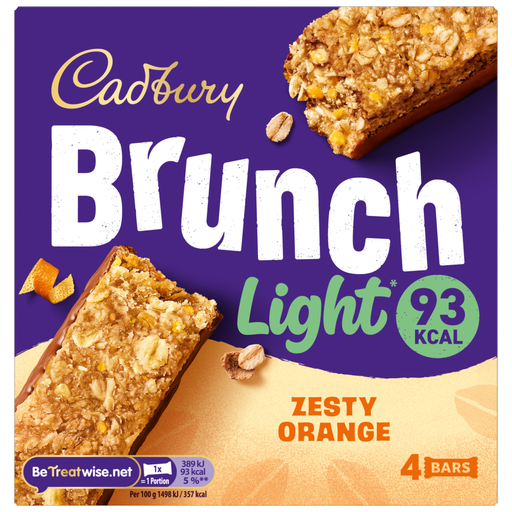 No image available
If the “Light” name interests you, check the pack’s fat and carbohydrate figures rather than using the name to judge the bar. This is a four-bar, 104g pack; compare the label’s serving with the amount you intend to eat.
 No image available
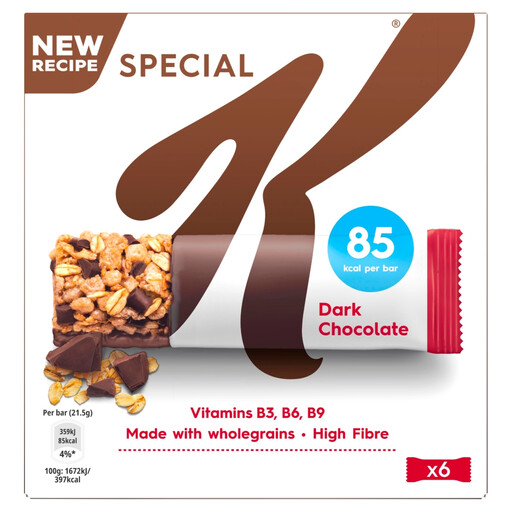
For a fat-focused comparison, check total fat per 100g alongside carbohydrate per bar. This pack contains six 21.5g bars; use the figures for this pack rather than those for a differently sized Red Berry bar.
 No image available
Compare this chocolate variant on its own nutrition panel, especially if you are weighing fat against carbohydrate and sugars. The pack contains six 21.5g snacks.
 No image available
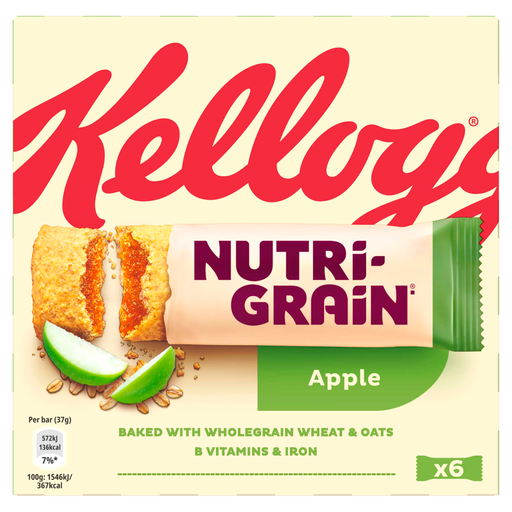
If you are considering a fruity breakfast bar as a snack, check its carbohydrate and sugars as well as fat for the portion you will eat. This apple variant comes in a six-bar, 222g pack.
 No image available
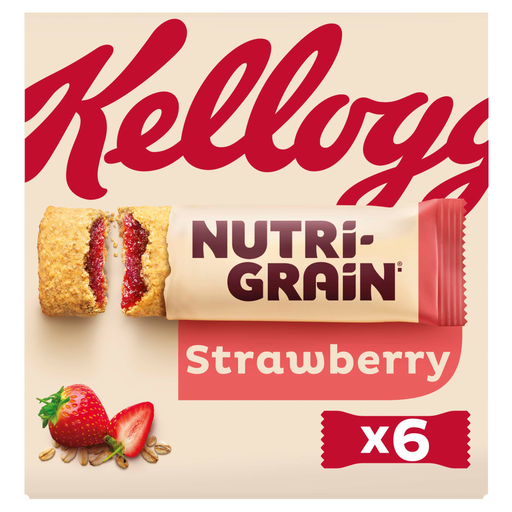
Check this strawberry variant’s own nutrition panel when comparing it with other fruit bars; the flavour name does not establish its sugar or carbohydrate content. The pack contains six bars and weighs 222g.
No—not by itself. Diabetes UK advises checking total carbohydrate, which is not shown by front-of-pack traffic lights. Read the amount for the portion you intend to eat alongside sugars, total fat and saturated fat.
Use per-100g figures to compare total fat, saturated fat and sugars across bars, then check total carbohydrate and the other values for the portion you will actually eat. A pack’s suggested serving may differ from that portion.
Yes. Waitrose & Partners lists 2.7g sugars and 6.5g fat per 30g serving of Graze Cocoa Vanilla Oat Boosts. Check both columns rather than treating the sugar figure as a guide to fat content.
The carbohydrate figure identifies the amount in the stated portion, but it does not provide an individual insulin dose. Diabetes UK explains that insulin-to-carbohydrate ratios are worked out and adjusted with a diabetes healthcare team.
Read the ingredients and any “may contain” statement on the exact current pack. Ingredients and precautionary statements vary between products and can change when recipes are updated, so another flavour or an older online listing is not a substitute.